Visitor Statistics
See how visitors use your audio guides, which stops attract attention, and where engagement falls away. Compare languages and time periods, then use the findings to improve content, signage, and exhibition layout. Insights update as guides sync with Look2Guide.
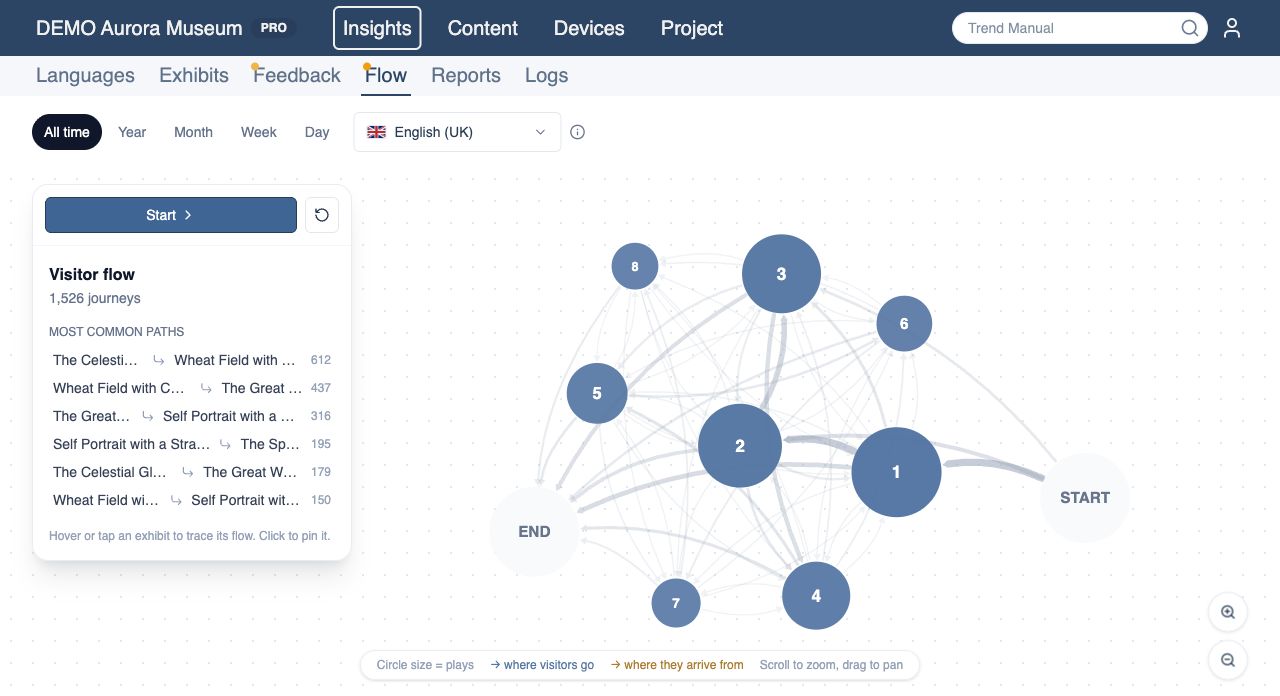
Understand visitor flows
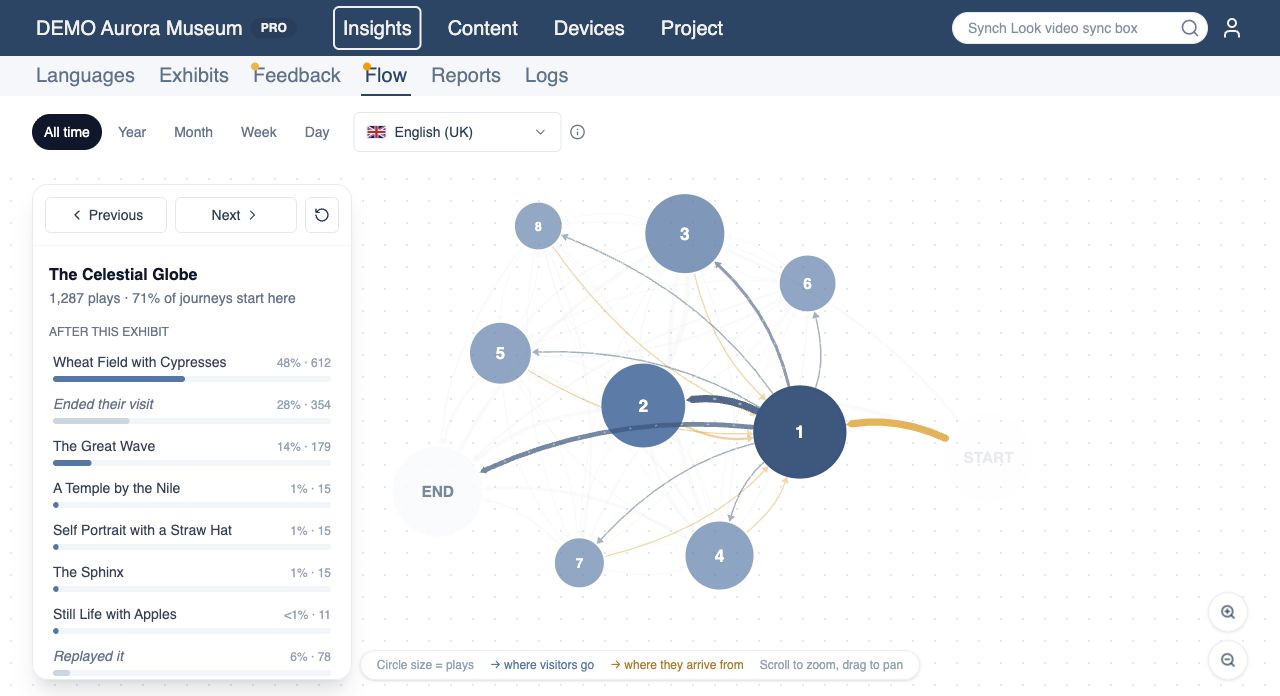
See common sequences between exhibits and the next stops visitors choose, using compatible guide data. Routes that bypass a section can reveal places worth reviewing. Improve signage, move an exhibit, or reorganize the route, then compare later periods.
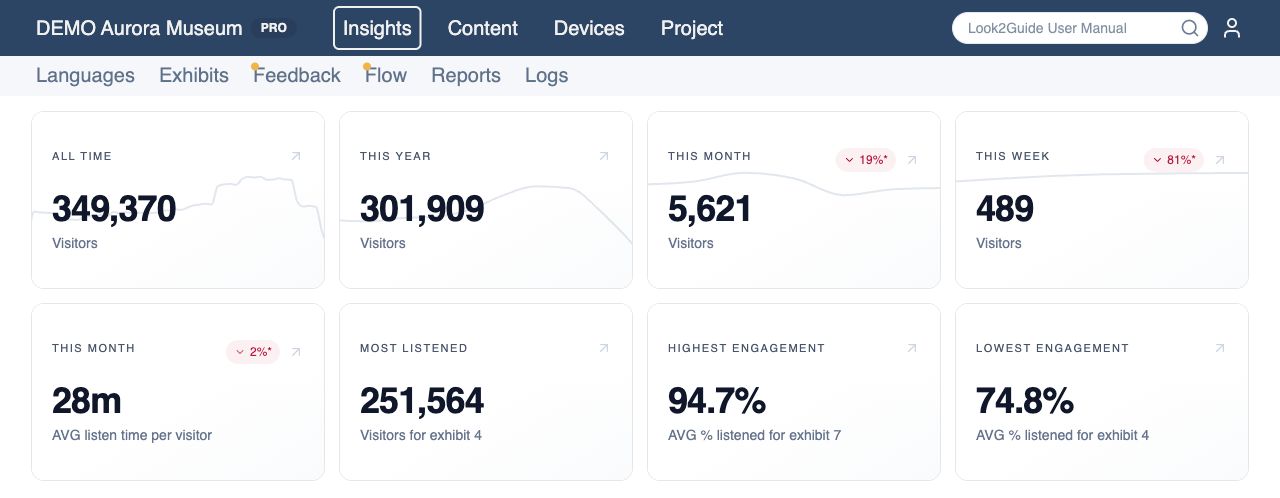
Compare visits over time
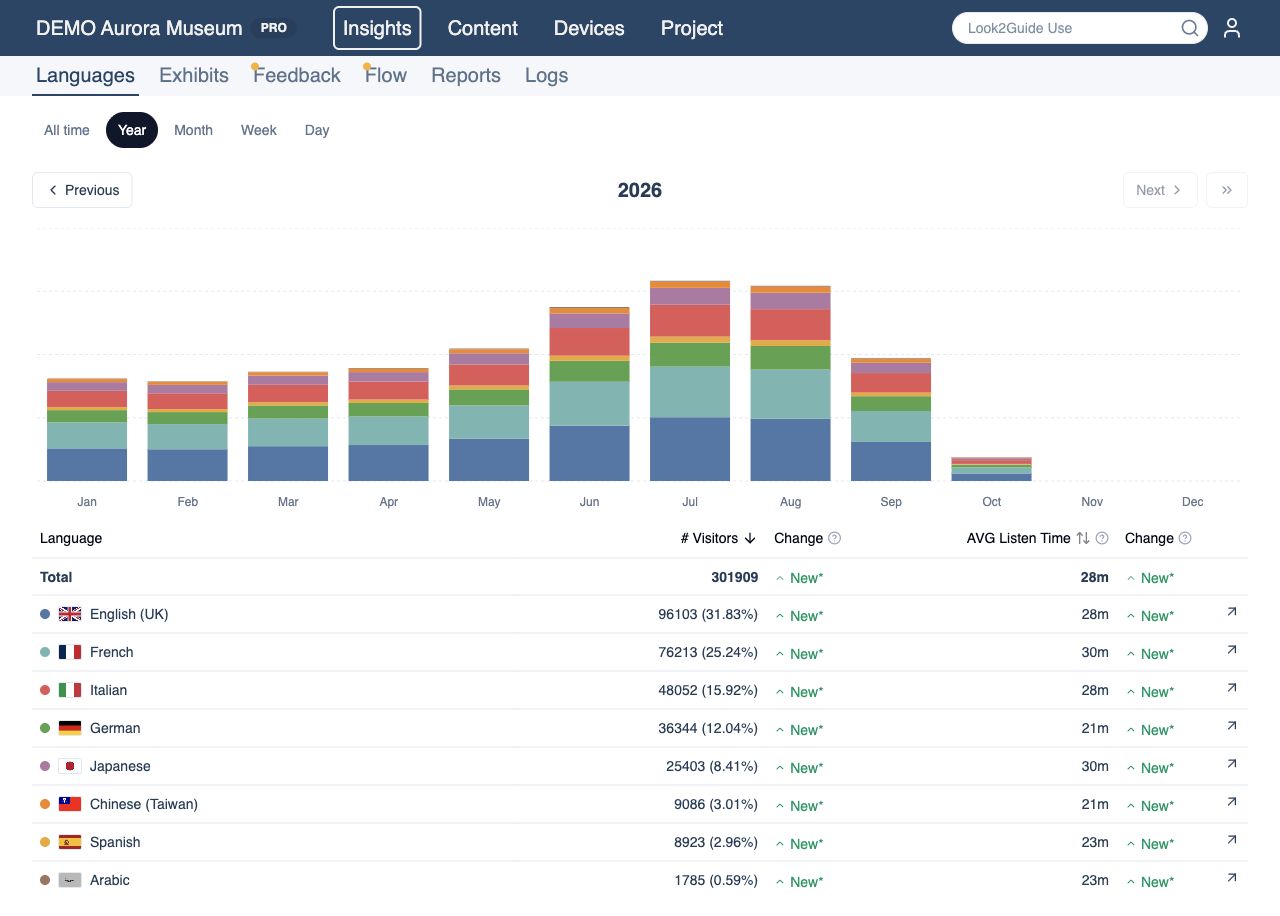
Review guide usage and average listening time by day, week, month, or year. Compare busy and quiet periods to plan guide availability and evaluate changes to the visitor experience.
Compare visitor languages
Compare guide usage and listening time across languages. Understand which language versions visitors use most and where narration or translation may need attention.
Find stops worth improving
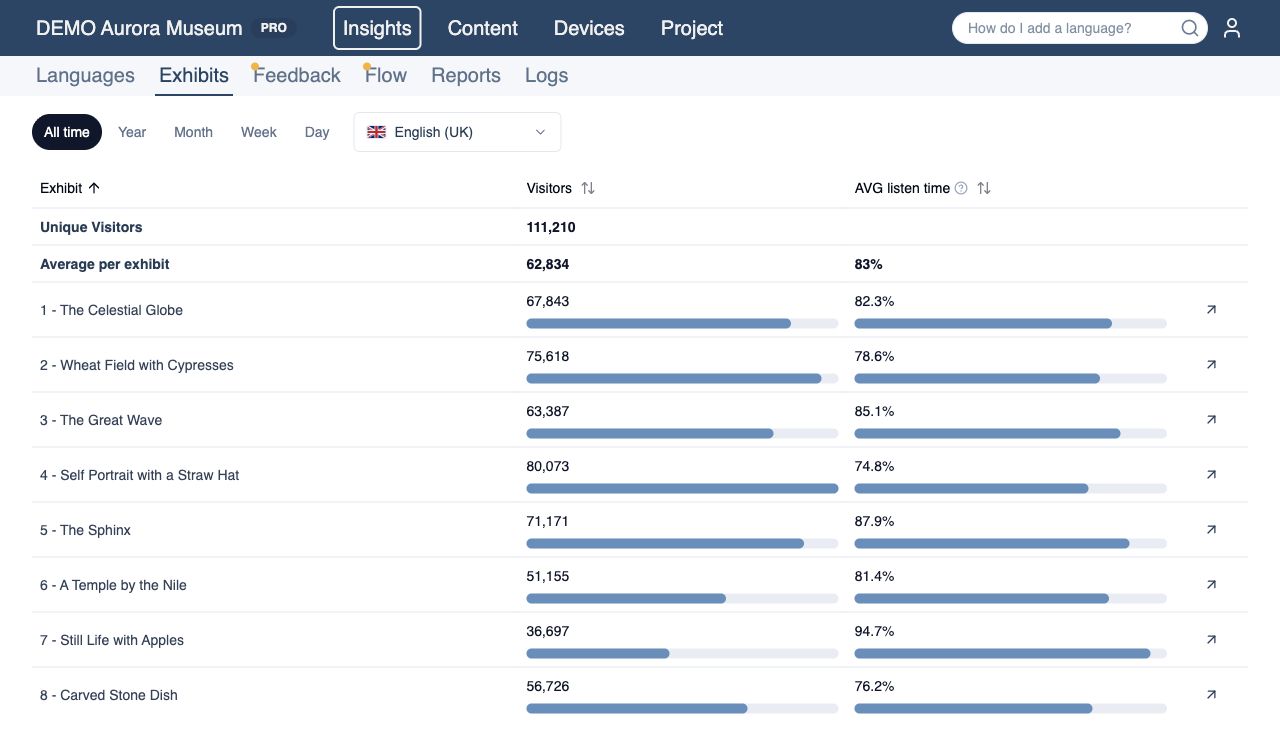
Compare plays and how much of each recording visitors hear. Low engagement can signal content or sections worth a closer look. Try a shorter story, a stronger introduction, or clearer placement, then check whether listening improves.
Tech specs
Software
- Browser-based analytics accessible from any modern browser
- Insights updated when guides upload their usage data
- Visitor counts and average listening time by period
- Language and exhibit engagement comparisons
- Visitor flow with compatible interaction data
- Viewer and administrator access across projects